San Antonio’s Real Estate Reset: Decoding the January 2026 Market Shift
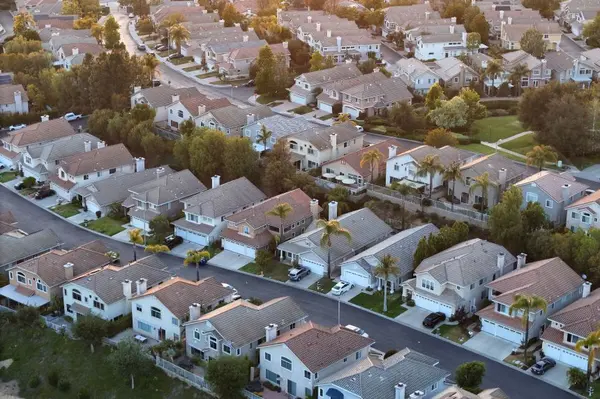
The start of a new year always brings a sense of anticipation to the San Antonio real estate market, but 2026 has arrived with a particularly clear message: the era of "market normalization" is officially here. For those who have navigated the volatility of the past few years, the January 2026 data from the San Antonio Board of REALTORS® (SABOR) offers a refreshing, data-driven narrative of stability and strategic opportunity.
Whether you are looking to sell a family home in Stone Oak or are a military family planning a PCS move to Joint Base San Antonio, understanding these numbers is the first step in "Selling Smart." This isn't just a list of statistics; it’s a roadmap for making informed financial decisions in a market that is finding its equilibrium.
The Big Picture: By the Numbers
The January 2026 report highlights a market that is cooling in pace but remaining resilient in value. Here are the core metrics that defined the start of the year:
-
Median Home Price: $292,999 (Down 1% year-over-year)
-
Average Home Price: $362,130 (Up 3% year-over-year)
-
Active Listings: 15,033 (Up 11% year-over-year)
-
Months of Inventory: 5.49 months
-
Days on Market (DOM): 98 days (Up 17% year-over-year)
-
Close Price to List Price: 91.4%
At first glance, a 1% dip in median price might cause concern, but when viewed alongside a 3% increase in the average sales price, a different story emerges. The market isn't losing value; it is recalibrating. The gap between median and average prices suggests that while entry-level and mid-market homes are stabilizing, the upper-tier and luxury segments continue to see strong activity, pulling the average upward.
The Inventory Surge and the "Balanced Market"
Perhaps the most significant number in this report is 5.49 months of inventory. In real estate, six months of inventory is traditionally considered a "neutral" or "balanced" market—one where neither the buyer nor the seller has a distinct, overwhelming advantage.
With over 15,000 active listings—an 11% increase from last year—San Antonio has moved firmly away from the inventory droughts of 2021 and 2022. This volume gives the local market breathing room. It means that the "take it or leave it" environment has vanished, replaced by a climate where quality, presentation, and data-driven pricing are the primary drivers of success.
Insights for Sellers: The Strategy of Precision
For sellers in 2026, the strategy has shifted from "How high can I go?" to "How smart can I price?" With homes averaging 98 days on the market, patience and preparation are now the names of the game.
The fact that homes are closing at an average of 91.4% of their original list price is a vital piece of intelligence. It indicates that initial overpricing is being met with significant corrections. In a market with 5.4 months of supply, buyers are no longer in a rush. They are touring multiple homes, comparing finishes, and scrutinizing neighborhood data before making an offer.
To succeed as a seller in today’s San Antonio market:
-
Data-Driven Pricing: Use the current $169 price-per-square-foot average as a baseline, but look deeper into submarket trends in areas like the North Central corridor or Northwest San Antonio.
-
Marketing Excellence: When inventory is high, "standard" marketing isn't enough. Professional photography, strategic digital placement, and education-based descriptions that highlight the "why" of a home’s value are essential.
-
Seller Concessions: The 2026 landscape often involves sellers assisting with closing costs or interest rate buydowns to help buyers cross the finish line.
Insights for Buyers: Leverage and Selection
If you felt sidelined during the hyper-competitive years, January 2026 is your "green light" moment. The current environment offers three distinct advantages for buyers:
1. Negotiating Power: With properties staying on the market longer, sellers are more inclined to negotiate on inspections, repairs, and price. Closing at 91.4% of the list price means there is often room to find a deal that fits your budget.
2. Selection and Variety: Whether you are targeting specific school districts in Kinder Ranch or looking for established charm in Deerfield, the 11% increase in listings means you can be selective. You no longer have to sacrifice your "must-haves" for the sake of speed.
3. Economic Stability: With inflation easing to roughly 2.4% and mortgage rates hovering around 6.04%, the extreme volatility of the past few years has leveled off. This predictability allows for better long-term financial planning.
For military families and those using VA benefits, this market is particularly welcoming. Appraisal gaps are less frequent, and the increased inventory makes it easier to find a home that meets the strict safety and habitability standards required for VA financing.
The Local Context: Neighborhood Matters
While city-wide stats provide a pulse, San Antonio is a city of distinct submarkets. The North Central and Northwest corridors—including communities like Cibolo Canyons, Timberwood Park, and Stone Oak—often move at a different rhythm than the general MLS.
In high-demand areas, the "Days on Market" might be lower than the 98-day average, while "Close-to-List" percentages might be higher. This is where education-based marketing becomes critical. Understanding the specific absorption rate of your neighborhood is the difference between a listing that lingers and one that sells.
Final Thoughts: Making the Move
The San Antonio real estate market of January 2026 is healthy, functional, and fair. It is a market that rewards those who do their homework and punishes those who rely on guesswork. The increase in inventory and the stabilization of prices provide a unique window of opportunity for move-up buyers to find more space and for sellers to transition into their next chapter with clarity.

Recent Posts

Decoding the Builder Incentive Tactic: How to Secure a Sub-5% Rate in Today's Market

How the VA Financing Fee Waiver Changes the Math for 100% Disabled Veterans in Texas

Kinder Ranch Real Estate Market Report: July 2026 Mid-Summer Market Update Market Update
Navigating the ROAD to Housing Act: What the Historic Affordability Bill Means for San Antonio Buyers and Sellers

Stone Oak Real Estate Market Report: July 2026 Mid-Summer Deep Dive Market Update
Timberwood Park Real Estate Market Report: July 2026 Custom Acreage Update

Project Marvel & The Airport Expansion: Which Downtown San Antonio Zip Codes Will Appreciate Fastest?

What San Antonio Sellers Need to Fix Before Listing Their Home in 2026

Micro-Market Mastery: Decoding the Summer 2026 Stone Oak Real Estate Trends

Should You Wait for Interest Rates to Drop Before Buying a Home in San Antonio?
GET MORE INFORMATION